Presented are patents for:
(1) Estimating activation cerebral cortical sources from scalp site recorded encephalograms;
(2) Node excitation driving function measures for cerebral cortex network analysis.
PATENT US 9116835
Invention for estimating activation of cerebral cortical sources from scalp site recorded encephalograms using modeling of cortical sources and of muscle and ocular artifacts (more).
A method and apparatus for estimating activation of cerebral cortical sources from scalp site recorded encephalograms using modeling of cortical sources and of muscle and ocular artifacts, where cortical source modeling may be performed with autoregressive spectra parameterization, the source modeling is projected as signals at the scalp locations, and the projected scalp signals with the modeled scalp artifacts are compared to those for the recorded data. A recursive technique may be used to adjust the source model parameters for a best fit of the compared signals. In some embodiments, muscle and ocular measurements provide a basis for artifact modeling, where recordings of ocular orientations and eye-blinks are used as determinates for sources of electrooculogram potentials, and recordings of facial expressions and limb postures as determinates of electromyogram potential sources.
The cortical source modeling for the patent is further described in a research paper on computer simulation of scalp site electrical signals in the presence of artifacts here referenced (more).
The simulation process provides time-wise electrical voltage signals for scalp site potentials as contributed from dipole oscillators as brain neural sources with autoregressive spectra parameterization, and from artifacts generated by eye movements, eye blinks, and muscle movements, where the artifact potentials at the scalp sites are attenuated by the spread of the source potential over the scalp. Considering the electrode site recording amplifier as a summing operational amplifier, the measured electroencephalogram is the sum of the potentials from these sources at that site. In the simplest form, a standard three-dimensional spherical head model is used to project the source excitations from their cortical locations to the scalp sites, where the source locations are embedded in a MNI reference Talairach head coordinate space by Brodmann Areas for known cortical attention networks of eye-movements, working memory, spatial distribution, and temporal expectation, among others for cognitive functions, in the cerebral cortex frontal, temporal and parietal brain regions. A schematic of the simulation elements follows.
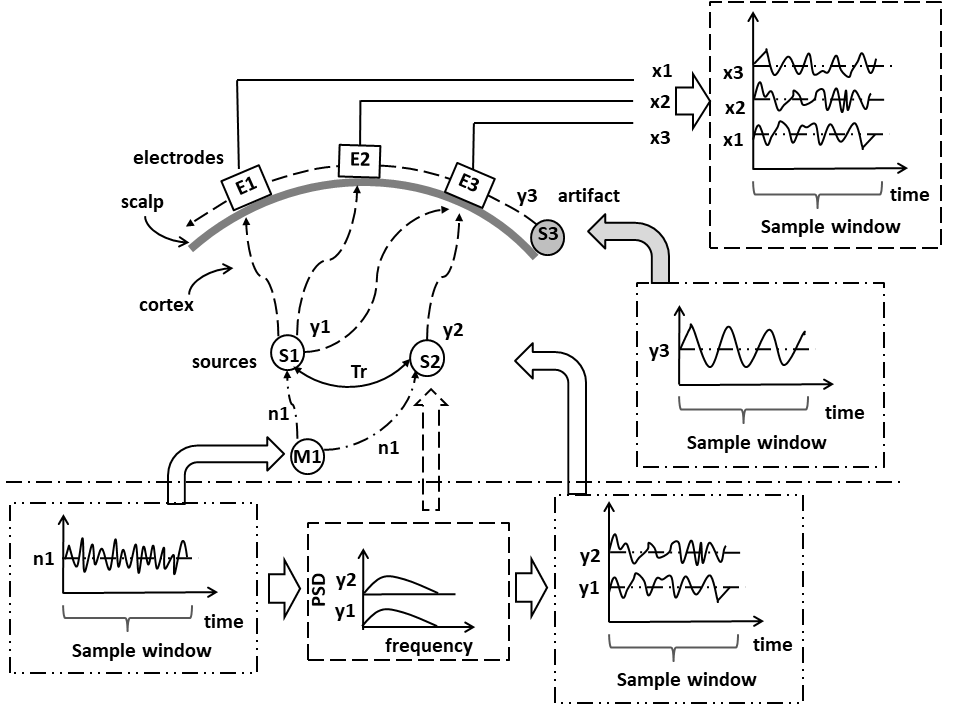
Schematic of simulation process elements showing representative scalp with electrodes and artifact source overlaid over the cortex with dipole oscillators as brain neural sources, and electrical pathways for the time-wise generated source signals.
The invention as a simulation process has been applied to the determination of the effectiveness of artifact rejection techniques in electroencephalograms data reduction as described in the research paper here referenced (more).
The site potential signals are used for the testing of the effectiveness of signal analysis techniques by comparing the results of processing the scalp signals to that of those generated by the neural sources without artifacts as a base truth reference. The effectiveness of artifact rejection for EEG data reduction is determined for several available open-literature techniques as a function of epoch size, electrode site location, and artifact intensity and quantity, as is the effect on the application of independent component analysis to isolate artifact sources from the EEG data base, as well as that of the reference electrode placement. An example of an application result follows.
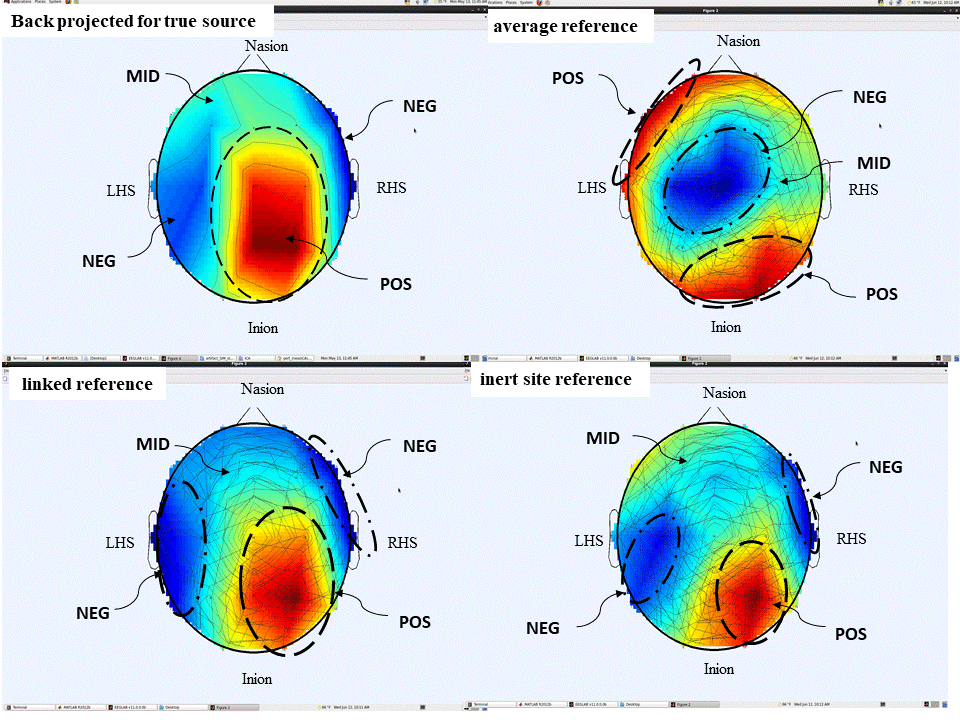
Example application for comparison of the effect of reference electrode on electroencephalograms as demonstrated by scalp topological plots of the back projected true source alpha band peak amplitude for the linked reference, average reference, and inert site reference configurations. The topology plots show that the linked reference most closely matches the back projected true source.
The invention as a simulation process has been applied to estimating electroencephalograms for a vehicle driving task as described in the research paper referenced here (more).
The electroencephalograms (EEG) for a vehicle driving task are simulated using artificial neural source excitations and those artifacts particular to the task during an ambient disturbance of the vehicle control, such as say, by a lateral wind gust disturbing the steering control. The simulation provides time-wise electrical voltage signals for scalp site potentials as contributed from dipole oscillators as brain neural sources, and from artifacts generated by eye movements, eye blinks, and muscle movements. The simulation method is useable in the study of the effectiveness of signal analyses for such operations. The simulation stages are demonstrated in the following figures.
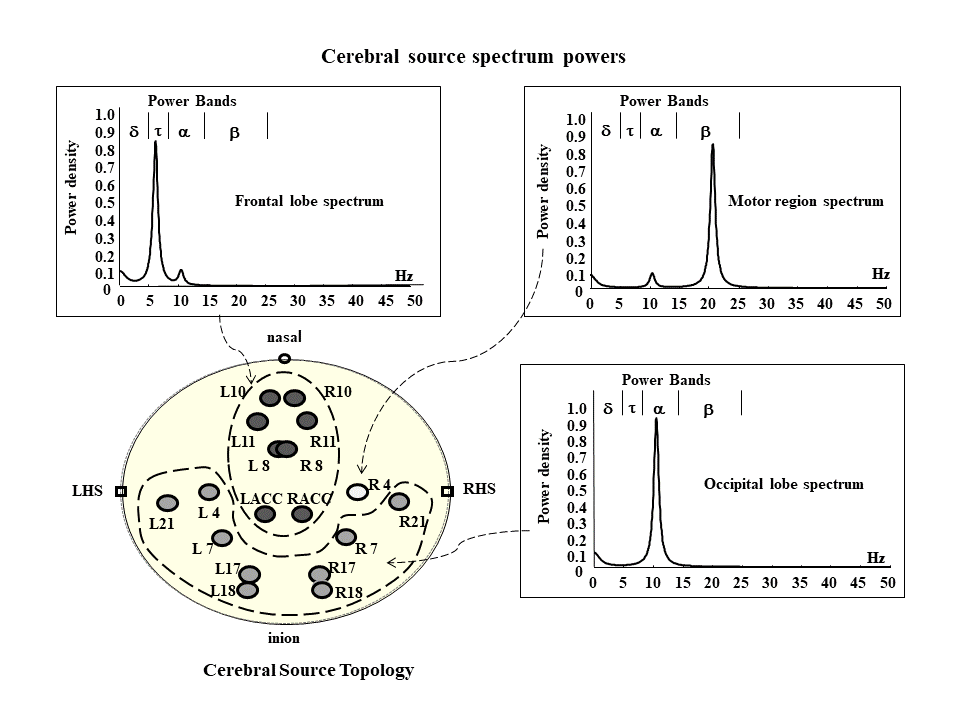
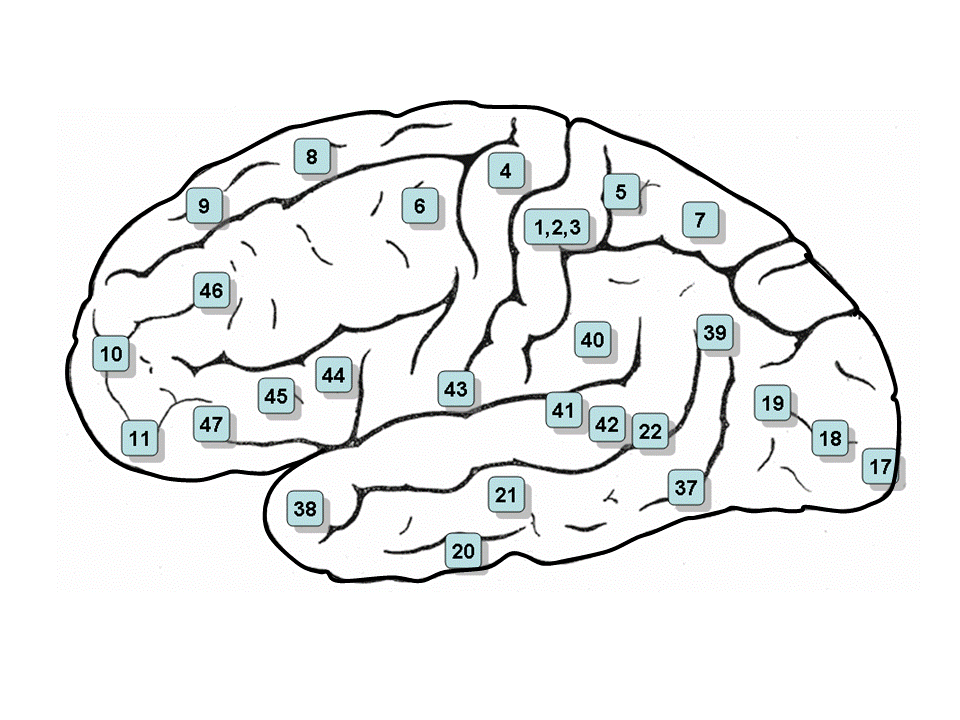
Cerebral neural sources activated during the steering control response as designated on a topology map of the cortex by Brodmann Areas labels, and the corresponding source power spectrums used in the simulation for the frontal, motor, and occipital lobe neural sources.
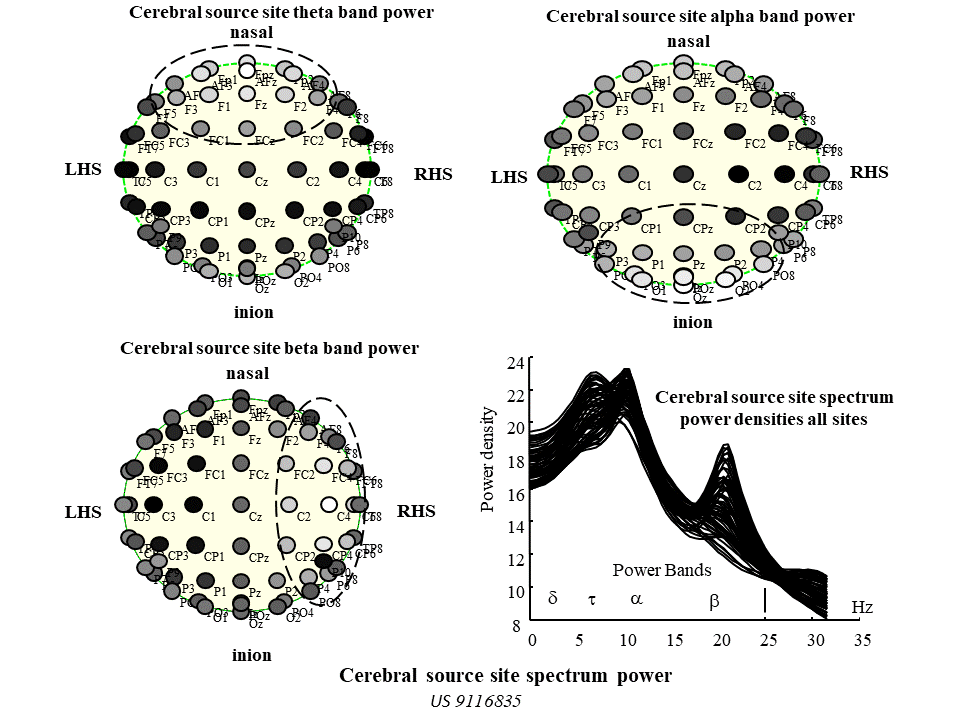
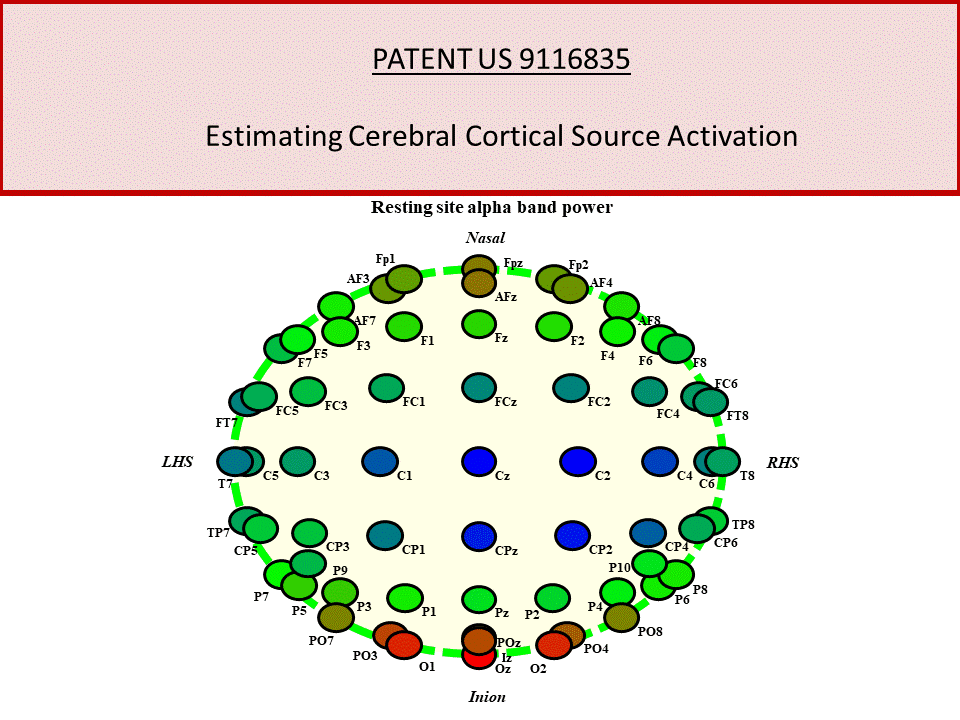
Cerebral source spectrum power projected to scalp electrode sites as demonstrated on a topological map of the scalp showing higher power (lighter sites) in the frontal region for the theta band, in the occipital region for the alpha band, and in the right lateral region for the theta power band; a spectrum power density plot by frequency for all electrode sites shows peaks correspondently in these power band regions.
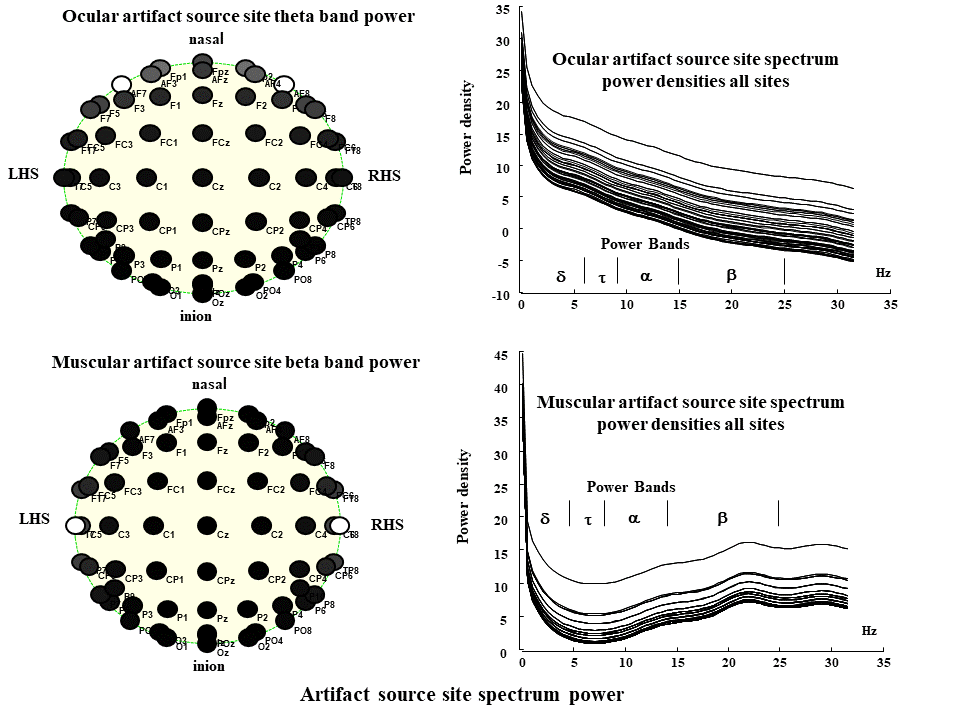
Artifact source spectrum power projected to scalp electrode sites as demonstrated on a topological map of the scalp with an accompanying power spectrum density plots for the sites; the plots show higher delta and theta band power in the frontal region for the ocular artifacts as generated by eye movements, and higher beta band power in the lateral regions for the muscular artifacts as generated by neck movements.
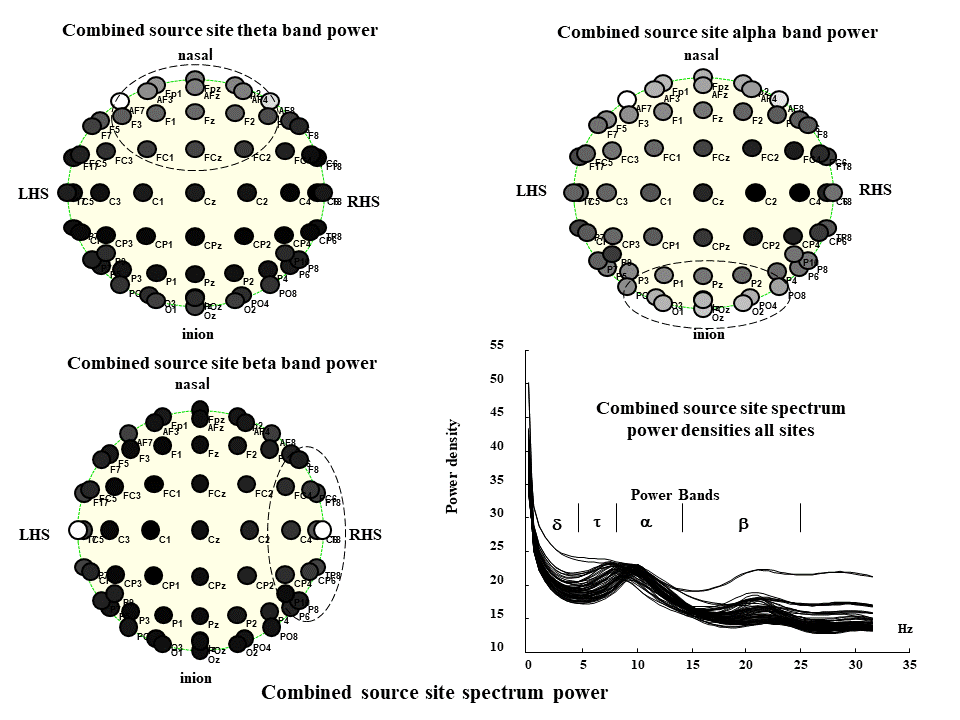
Combined cerebral and artifact source spectrum power measured at scalp electrode sites as demonstrated on a topological map of the scalp showing higher power (lighter sites) in the frontal region for the theta band, in the occipital region for the alpha band, and in the right lateral region for the theta power band; a spectrum power density plot for all electrode sites shows peaks correspondently in these power band regions. However, the addition of the artifact power dilutes the total power in these regions, particularly in the lateral region for the beta band; the power density plot shows the smearing of the theta and alpha peaks and reduction of the beta peak as compared to those of the plot for the cerebral sources alone.
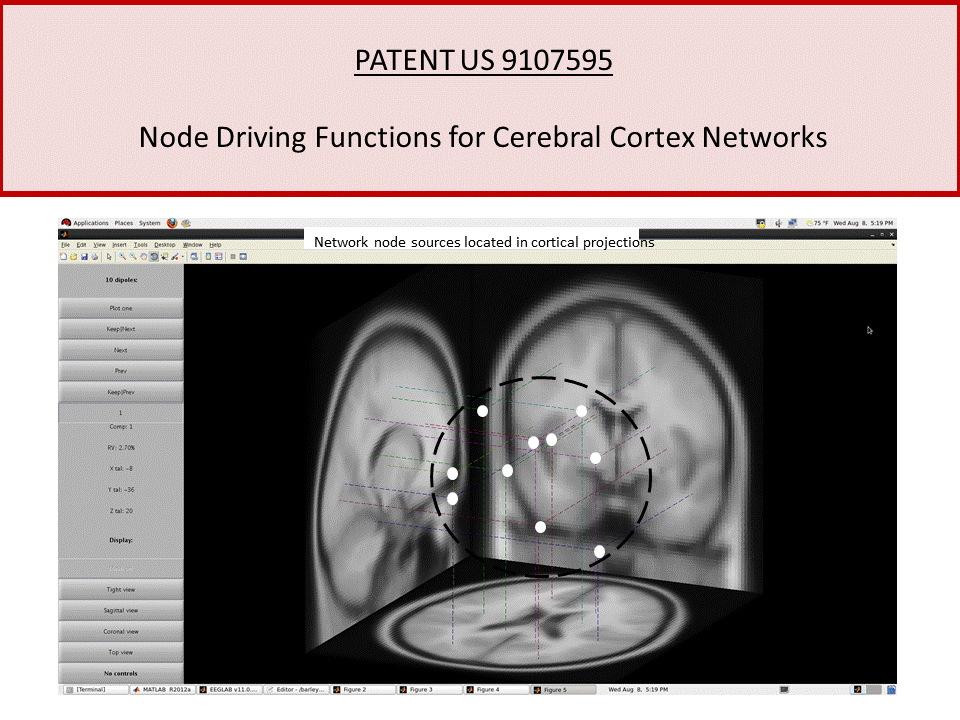
PATENT US 9107595
Node excitation driving function measures for
cerebral cortex network analysis of electroencephalograms (more)
A method and apparatus for estimating activation of cerebral cortex networks using the novel concept of node excitation driving functions as determined from scalp site recorded electroencephalograms (EEGs). The node-excitation driving function measures for the cortical sources of the network are derived by combining the node power and coherences into a single measure, and in turn modulation sources for the networks are derived from the driving functions to determine brain network activity. Application is made as a component of an automated aiding system in the electronic aiding of tasks performed by human operators by providing an estimate of brain functions from electroencephalogram measurements.
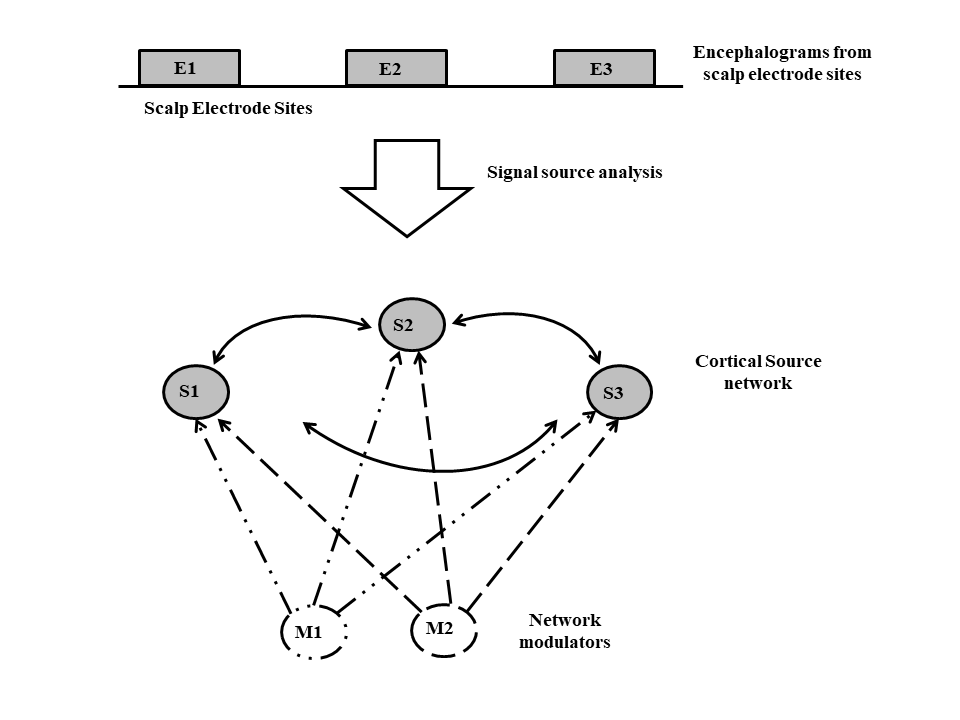
The figure is a schematic of the reduction of an electroencephalogram to a cortical source network for use in estimating brain activity with node excitation driving functions. The function combines the node power and coherences into a single measure for a plurality of cortical sources of the network. In turn, modulation sources for the networks are derived from the driving functions to classify brain network activity.
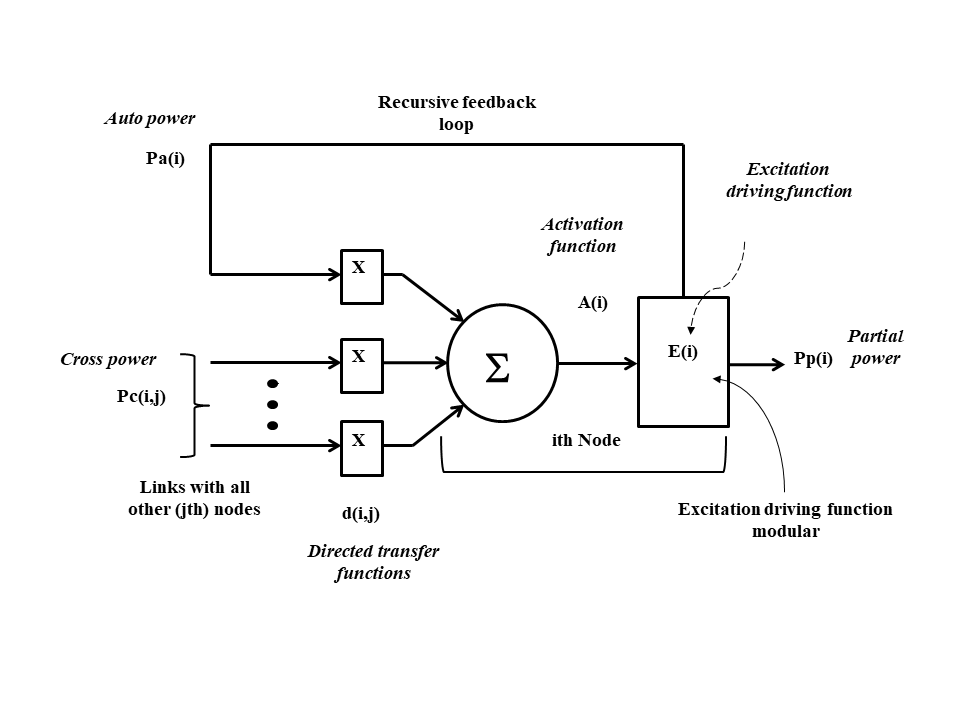
Figure is a schematic showing the node excitation driving function as defined by the spectral power matrix and normalized directed transfer functions for the node. The schematic shows the node (ith node) of the network consisting of a summer in series with an excitation driving modular, where the inputs to the summer are the cross power outputs (Sc(i,j)) from the other nodes (jth node) in the network and a recursive feedback from the node itself of the node auto power (Sa(i)), where the powers are elements of the spectral power matrix for that node. The inputs to the summer are weighted by normalized directed transfer functions (d(i,j) for the connecting links with the node including the feedback loop. The summer outputs a node activation function (A(i)) as the sum of the weighted inputs to the excitation driving modular that with the excitation driving function (E(i)) generates the partial power (Pp(i)) from the activation function as output for the node.
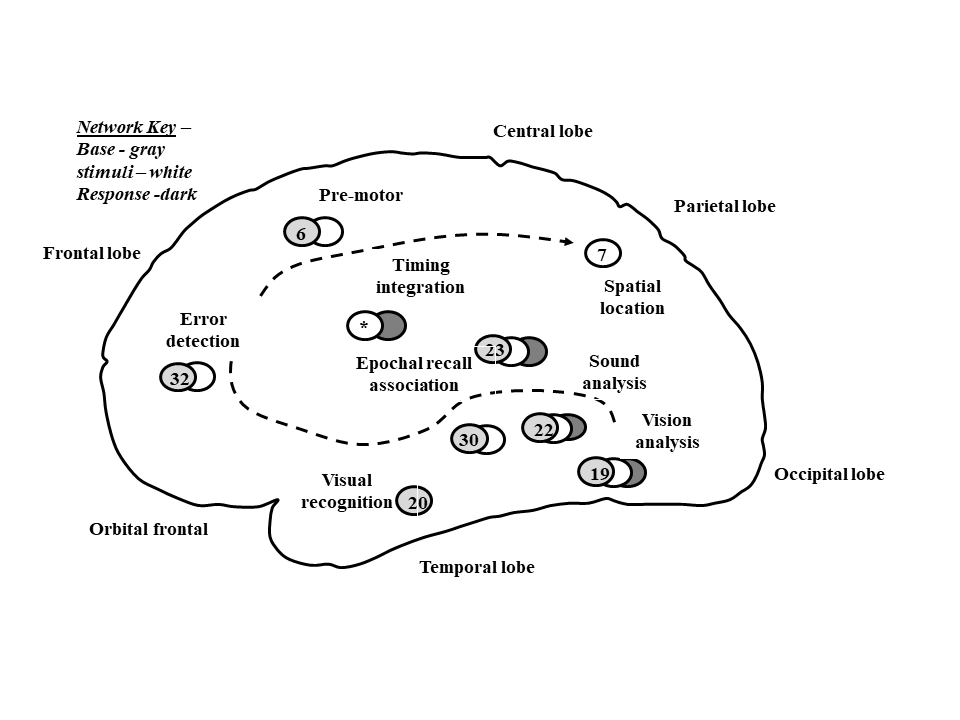
The figure shows a network derived from the analysis for a stimulus response experiment with the Brodmann Areas involved superimposed on a side view of the cortex. Here, the network includes cognitive functions for stimulus analysis (BA 9, BA 22), association (BA 23), recognition (BA 20), error detection (BA 32), pre-motor planning (BA 6), and spatial locating (BA 7) presumably of the choice response button. Note that not all cortical sources map to Broadman Areas in the neocortex region, but some may instead be in the allocortex; here, the network includes a node (*) for the claustrum structure in the sub-lobar lobe for timing in the stimulus and responses events. Sources in the base network are grayscale colored gray, those of the stimulus white, and the response dark gray. Information flow is shown by the directed line.